Go语言的垃圾回收:第二部分 GC追踪
[原文] Garbage Collection In Go : Part II - GC Traces
锲子
这是由三部分构成的系列中的第二篇,它将提供Go语言垃圾回收背后的语义和机制的理解。这篇文章重点介绍如何生成GC跟踪并解释它们。
三部分系列文章的索引:
- Garbage Collection In Go : Part I - Semantics
- Garbage Collection In Go : Part II - GC Traces
- Garbage Collection In Go : Part III - GC Pacing
介绍
在第一篇文章,我花时间描述了垃圾收集器的行为以及减少垃圾收集器注入到您运行的应用系统的延迟。我分享了如何生成并解释GC追踪,显示了堆内存是如何改变的,并解释了GC阶段的不同以及他们是如何影响延迟开销的。
文章最后的结论是,如果你减少堆的压力,你将减少延迟开销,进而提升应用程序的性能。我也提出了一点,通过找到一种方式在任何两个收集之意减少时间,来减少收集开始的节奏不是一个好的策略。保持一致的速度(即使速度很快)会更好地保持应用程序以最佳性能运行。
在这篇文章中,我将引导您运行一个实际的Web应用程序,并向您展示如何生成GC跟踪和应用程序配置文件。 然后,我将向您展示如何解释这些工具的输出,以便您找到提高应用程序性能的方法。
运行应用程序
看一下我在Go培训中使用的Web应用程序。
Figure 1

https://github.com/ardanlabs/gotraining/tree/master/topics/go/profiling/project
图表1显示了应用程序的外观。该应用程序从不同的新闻提供者那里下载三套rss feed,并允许用户执行搜索。 构建Web应用程序后,将启动该应用程序。
Listing 1
|
|
清单1显示了应用程序如何以 GOGC 变量设置为 off 为开始,它是将垃圾回收关闭。日志被重写向到 /dev/null 设备。应用运行后,请求可以被发送到服务中。
Listing 2
|
|
清单2显示了如何使用 hey 工具,通过使用100个连接发送10k个请求发送往服务器。当所有的请求被发送到服务,产生如下的结果。
Figure 2
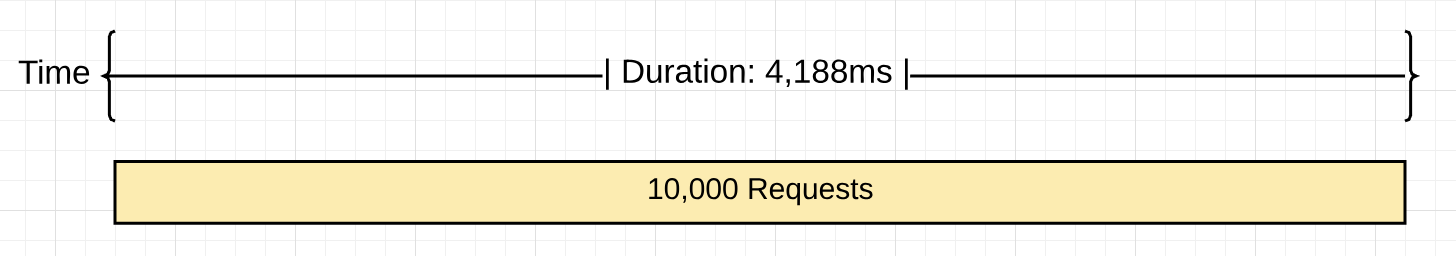
图表2显示了一个可视化的代表垃圾收集关闭后处理10k个请求。它使用 4188ms来处理10k个请求,这使得服务每秒处理大约2387个请求。
打开垃圾回收
如果这个应用打开了垃圾回收会发生什么?
Listing 3
|
|
清单3显示了如何移除了 GOGC 变量,使用 GODEBUG 变量代替来启动应用程序查看GC追踪。设置了 GODEBUG 变量,所以运行时在每次收集发生的时候都会生成一个GC追踪。现在再次运行同样的10k个请求到服务器上。通过服务器发送所有请求后,就会有可以分析的 hey 工具提供的GC跟踪和信息。
Listing 4
|
|
清单4显示了运行时产生的第三个和最后一个GC追踪。我没有显示前两个收集,因为这些收集发生后,负载是通过服务器发送的。 最后一个收集显示需要2551个收集(减去前两个收集,因为它们不计在内)处理了1万个请求。
这是跟踪中每个部分的细分。
Listing 5
|
|
清单5显示了从最后一个收集中实际的数字,多亏了 hey,这些是运行后的性能结果。
Listing 6
|
|
清单6显示了结果。以下内容提供了更多的可视化信息。
Figure 3
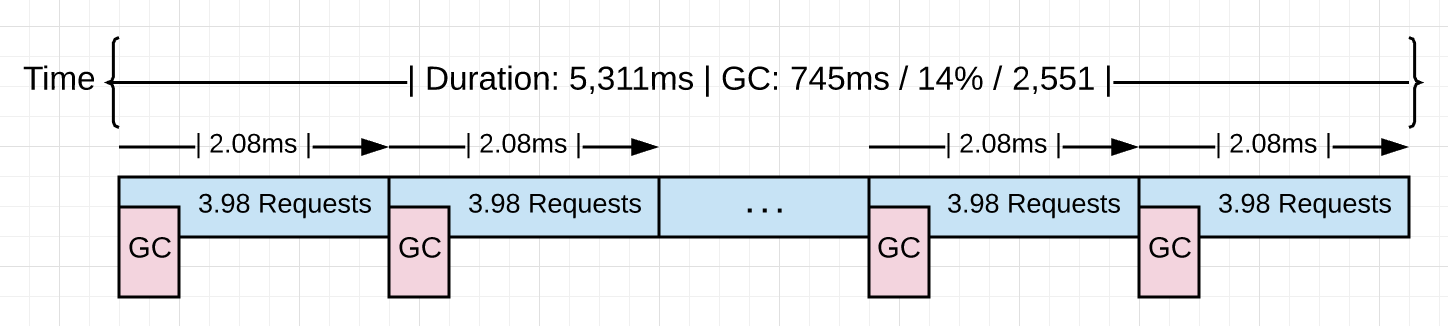
图表3直观地显示了发生了什么。当收集器打开后,它必须运行大约2.5k的时间来处理同样的10k个请求。每个收集平均启动速度约2.0ms,运行所有这些收集增加了额外的 1.1秒的延迟。
Figure 4
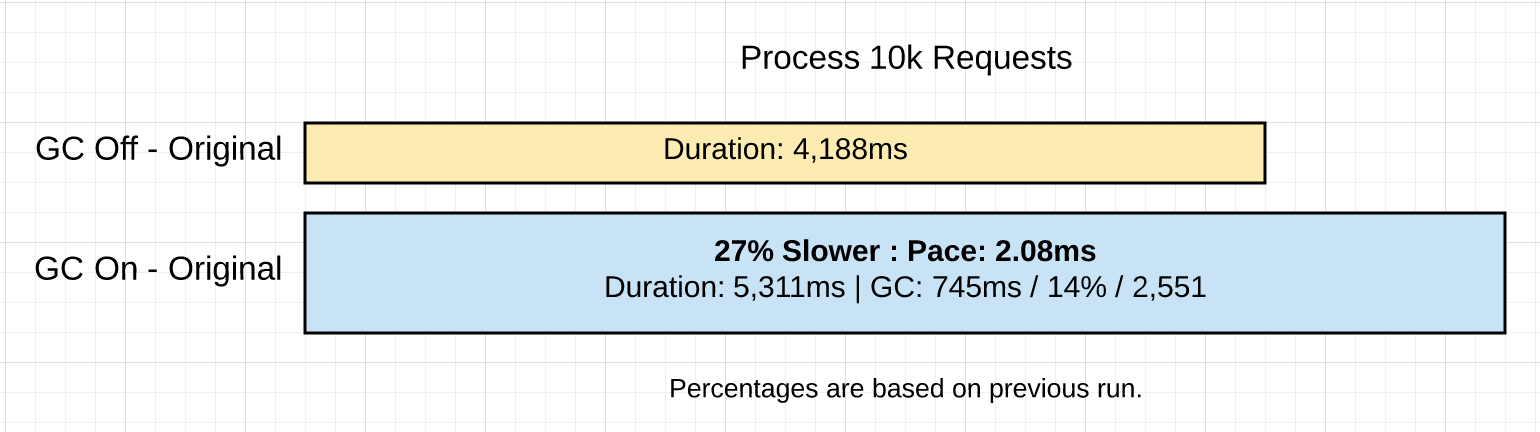
图表4显示了目前两个运行应用程序的对比。
减少分配
获得一个堆的profile,并查看是否有可以被移除的非生产性分配是很棒的。
Listing 7
|
|
清单7显示了使用 pprof 工具调用 /debug/pprof/allocs 端点来从运行的应用程序中获取内存profile。这个端点存在是因为下面的代码。
Listing 8
|
|
清单8显示了如何在任何应用程序中绑定 /debug/pprof/allocs 端点。添加导入包 net/http/pprof 绑定端点到默认的服务多路复用器。然后使用 http.ListenAndServer 和常量 http.DeefaultServerMux 使端点可用。
当 profiler 启动,可以使用 top 命令查看分配最多的前6个函数。
Listing 9
(pprof) top 6 -cum
Showing nodes accounting for 0.56GB, 5.84% of 9.56GB total
Dropped 80 nodes (cum <= 0.05GB)
Showing top 6 nodes out of 51
      flat  flat%   sum%        cum   cum%
         0     0%     0%     4.96GB 51.90%  net/http.(*conn).serve
    0.49GB  5.11%  5.11%     4.93GB 51.55%  project/service.handler
         0     0%  5.11%     4.93GB 51.55%  net/http.(*ServeMux).ServeHTTP
         0     0%  5.11%     4.93GB 51.55%  net/http.HandlerFunc.ServeHTTP
         0     0%  5.11%     4.93GB 51.55%  net/http.serverHandler.ServeHTTP
    0.07GB  0.73%  5.84%     4.55GB 47.63%  project/search.rssSearch
清单9显示了在列表的底部,rssSearch 函数如何出现。该函数分配了5.96GB 中的 4.55GB 给数据。接下来,是时候使用 list 命令来检查 rssSearch 函数的细节了。
Listing 10
(pprof) list rssSearch
Total: 9.56GB
ROUTINE ======================== project/search.rssSearch in project/search/rss.go
   71.53MB     4.55GB (flat, cum) 47.63% of Total


         .          .    117:	// Capture the data we need for our results if we find ...
         .          .    118:	for _, item := range d.Channel.Items {
         .     4.48GB    119:		if strings.Contains(strings.ToLower(item.Description), strings.ToLower(term)) {
   48.53MB    48.53MB    120:			results = append(results, Result{
         .          .    121:				Engine:  engine,
         .          .    122:				Title:   item.Title,
         .          .    123:				Link:    item.Link,
         .          .    124:				Content: item.Description,
         .          .    125:			})
清单10显示了列表和代码。第119行突出显示为大部分分配。
Listing 11
. 4.48GB 119: if strings.Contains(strings.ToLower(item.Description), strings.ToLower(term)) {
清单11显示了问题中的代码行。到目前为止,仅该行就占该功能已分配的4.55GB内存中的4.48GB。 接下来,是时候审查一下代码行,看看有什么可以做的。
Listing 12
|
|
清单12显示了该行代码位于一个紧密的循环中。它调用了 strings.ToLower 创建了分配,因为它创建了新的需要被在堆上分配的字符串。这些 strings.ToLower 调用是不必要的,因为调用可以在循环外完成。
第119行可以修改为移除所有这些分配。
Listing 13
|
|
注意:你没有看到的其他代码的更改是在将 feed 要放入缓存之前,将描述转为小写。新的 feed 第15分外被缓存一次。将 term 转为小写的调用在循环外部被完成。
清单13显示了如何将 strings.ToLower 移除。项目在新的代码更改后,再次被编译,再次使用10k请求通过服务器。
Listing 14
$ go build
$ GODEBUG=gctrace=1 ./project > /dev/null
gc 3 @6.156s 0%: 0.011+0.72+0.068 ms clock, 0.13+0.21/1.5/3.2+0.82 ms cpu, 4->4->2 MB, 5 MB goal, 12 P
.
.
.
gc 1404 @8.808s 7%: 0.005+0.54+0.059 ms clock, 0.060+0.47/0.79/0.25+0.71 ms cpu, 4->5->2 MB, 5 MB goal, 12 P
清单14显示了在代码修改后,如何花费1402个收集处理相同的10k个请求的。这儿是两次运行的所有结果。
Listing 15
With Extra Allocations              Without Extra Allocations
======================================================================
Requests            : 10,000        Requests            : 10,000
----------------------------------------------------------------------
Requests/sec        : 1,882 r/s     Requests/sec        : 3,631 r/s
Total Duration      : 5,311ms       Total Duration      : 2,753 ms
Percent Time in GC  : 14%           Percent Time in GC  : 7%
Total Collections   : 2,551         Total Collections   : 1,402
----------------------------------------------------------------------
Total GC Duration   : 744.54ms      Total GC Duration   : 192.71 ms
Average Pace of GC  : ~2.08ms       Average Pace of GC  : ~1.96ms
Requests/Collection : ~3.98 r/gc    Requests/Collection : 7.13 r/gc
清单15显示了与最后一次结果的比较。以下内容提供了更多的可视化信息。
Figure 5
图表5直观地显示了发生了什么。此时收集器运行1149ms(少于1402和2551)来处理同样的10k个请求。结果将GC总时间的百分比从14%减少到7%。这使应用程序的运行速度提高了48%,而收集时间却减少了74%。
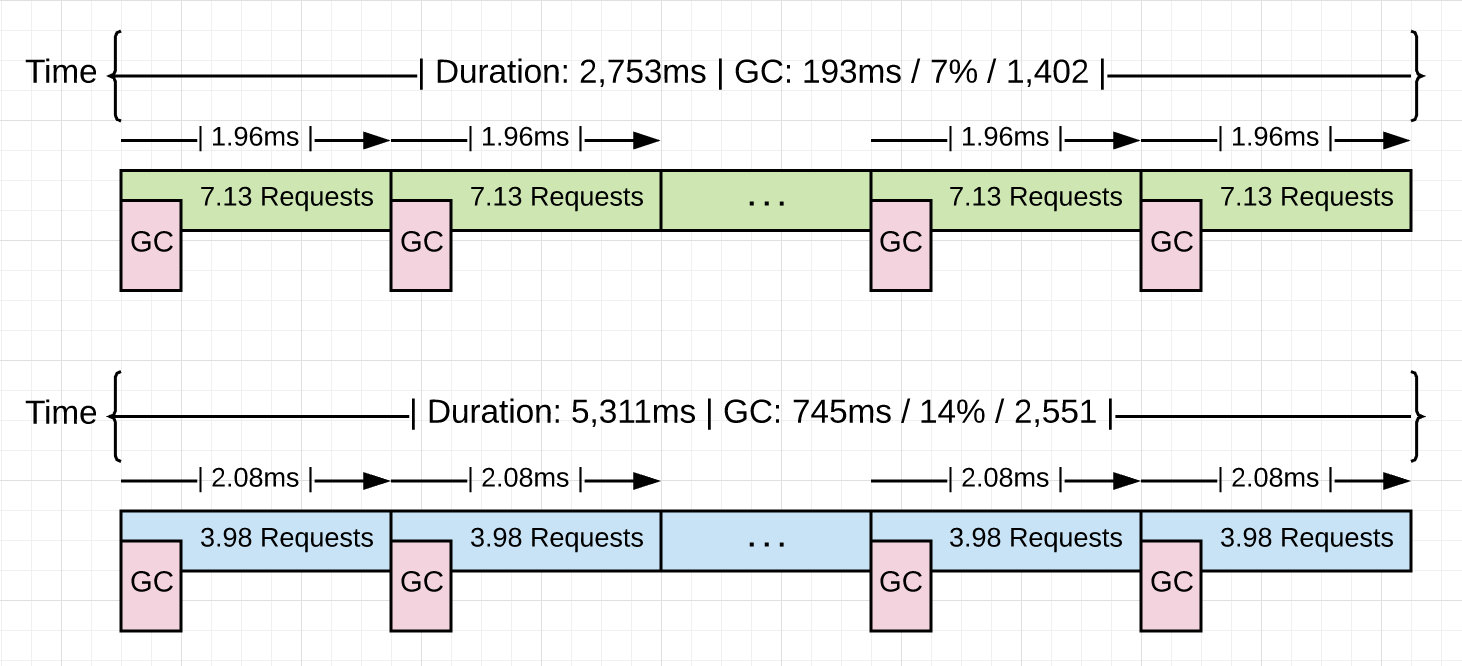
Figure 6
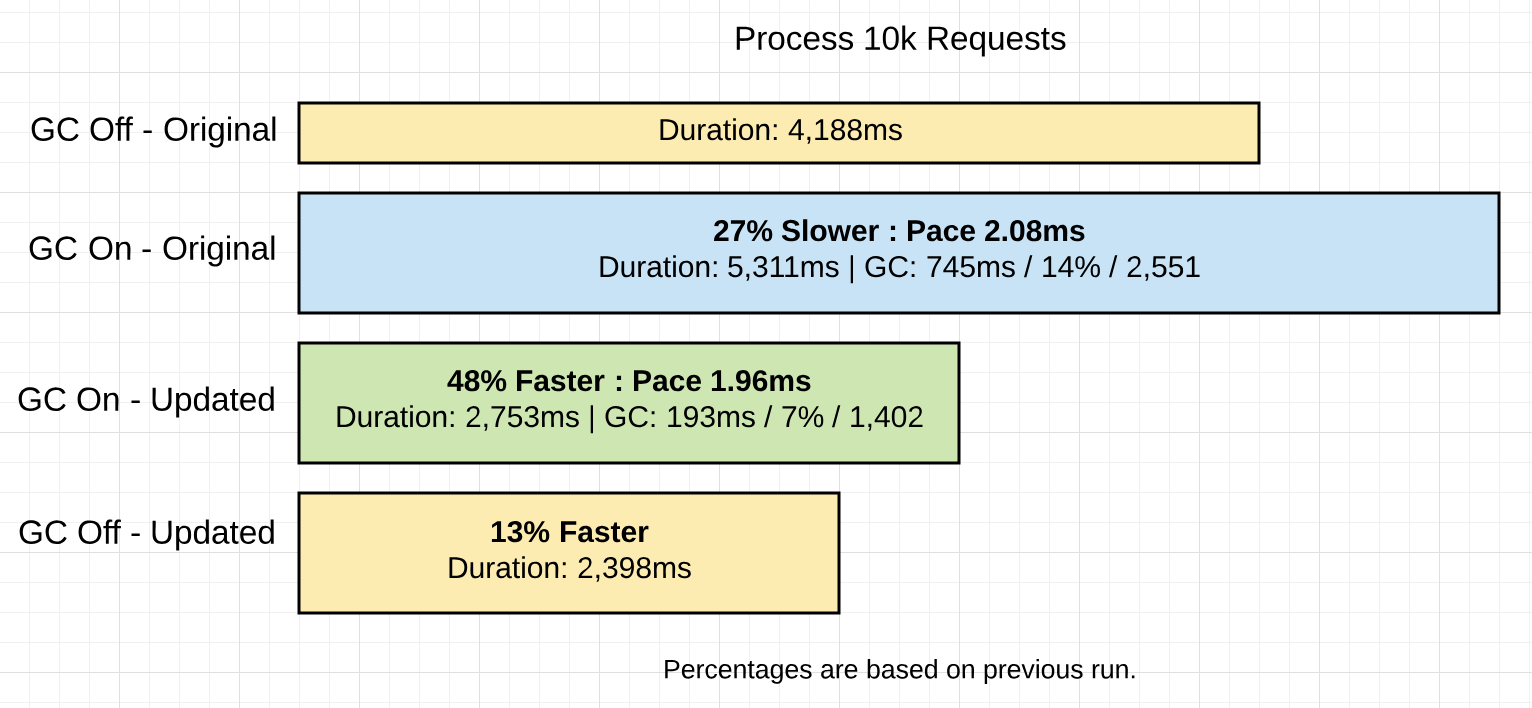
图6显示了该应用程序所有不同运行的比较。 我包含了运行的优化代码,而没有垃圾收集器来完成。
我们学到了什么
正如我在上一篇文章中声明的对收集器同情是减少堆的压力。记住,压力可以被定义为在给定的时间内,应用程序在所有可用的内存中分配得有多快。当压力减少,被收集中注入的延迟也相应的减少。正是延迟减缓了您的应用程序。
这不是关于减慢收集的速度。这是真正的关于在收集期间或每次收集间有更多的工作要做。通过减少分配给堆的任何工作量或分配数量,可以影响到这一点。
Listing 16
With Extra Allocations              Without Extra Allocations
======================================================================
Requests            : 10,000        Requests            : 10,000
----------------------------------------------------------------------
Requests/sec        : 1,882 r/s     Requests/sec        : 3,631 r/s
Total Duration      : 5,311ms       Total Duration      : 2,753 ms
Percent Time in GC  : 14%           Percent Time in GC  : 7%
Total Collections   : 2,551         Total Collections   : 1,402
----------------------------------------------------------------------
Total GC Duration   : 744.54ms      Total GC Duration   : 192.71 ms
Average Pace of GC  : ~2.08ms       Average Pace of GC  : ~1.96ms
Requests/Collection : ~3.98 r/gc    Requests/Collection : 7.13 r/gc
清单16显示了在垃圾收集打开时,两个版本的应用程序的结果。很明显在移除了4.48GB的分配,使应用运行得更快。有趣的是,每个收集(两个版本)的平均速度实际上是相同的,大约为2.0ms。 这两个版本之间的根本变化是每个收集之间要完成的工作量。 应用程序从3.98 r / gc变为7.13 r / gc。 完成的工作量增加了79.1%。
在任何两次收集启动期间,完成更多的工作,有助于减少收集的数目,收集的数目从2551减少到1402,减少了45%。该应用程序将总GC时间从745毫秒减少到193毫秒,减少了74%,并且每个收集版本的总GC时间从14%更改为7%。 当您运行不带垃圾回收的应用程序的优化版本时,性能差异仅13%,应用程序从2,753ms减少到2,398ms。
结论
如果您花时间专注于减少分配,那么您将作为Go开发人员尽一切努力来同情垃圾回收器。 您不会编写零分配的应用程序,因此重要的是要认识到生产性分配(对应用程序有帮助的分配)和非生产性分配(对应用程序有害的分配)之间的区别。 然后,您对垃圾收集器充满信心和信任,以使堆保持健康,并使您的应用程序始终运行。
拥有一个垃圾收集器是一个不错的权衡。 我将承担垃圾收集的费用,这样我就不会承担内存管理的负担。 Go是关于让您作为开发人员提高工作效率,同时仍然编写足够快的应用程序。 垃圾收集器是实现这一目标的重要组成部分。 在下一篇文章中,我将分享另一个程序,该程序显示收集器可以如何很好地分析Go应用程序并找到最佳的收集路径。